
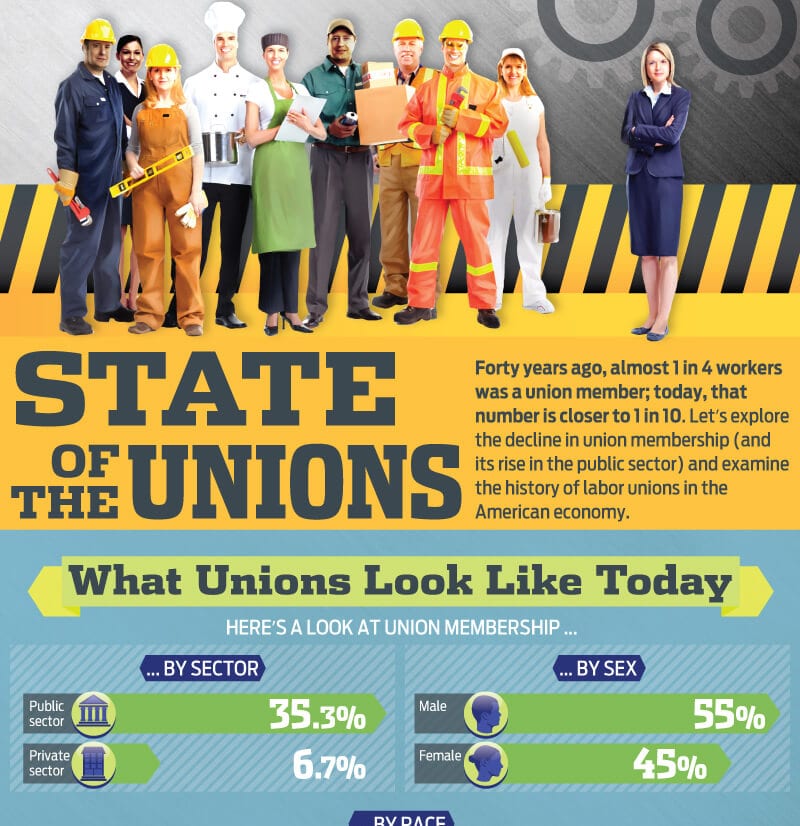
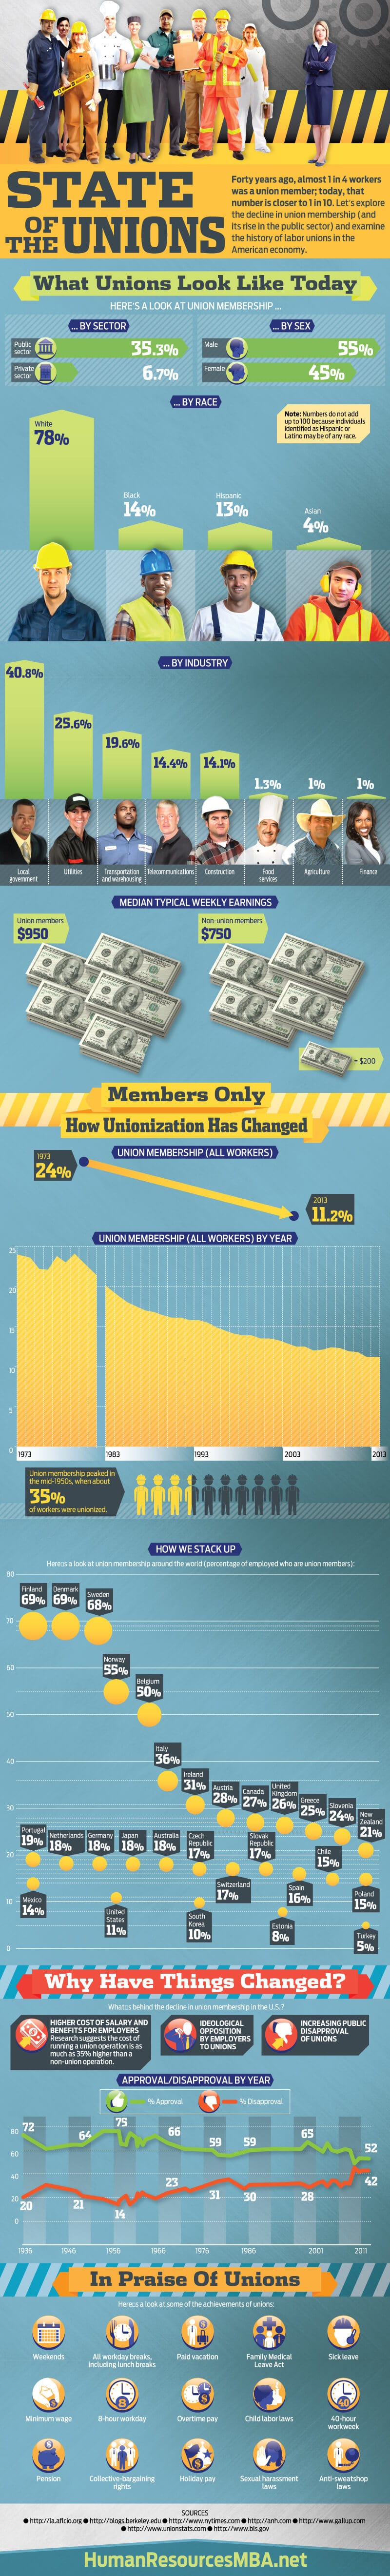
What Unions Look Like Today
Here’s a look at union membership …
… by sector
Public sector 35.3%
Private sector 6.7%
… by sex
Male 55%
Female 45%
… by race
White 78%
Black 14%
Asian 4%
Hispanic 13%
Note: Numbers do not add up to 100 because individuals identified as Hispanic or Latino may be of any race.
by industry
Local government 40.8%
Utilities 25.6%
Transportation and warehousing 19.6%
Telecommunications 14.4%
Construction 14.1%
Agriculture 1%
Finance 1%
Food services 1.3%
Median typical weekly earnings
Union members $950
Non-union members $750
Members Only — How Unionization Has Changed
Union membership (all workers)
1973 2013
24% 11.2%
Union membership (all workers) by year
1973 24.0%
1974 23.6%
1975 22.2%
1976 22.1%
1977 23.8%
1978 23.0%
1979 24.1%
1980 23.0%
1981 21.4%
1982 —
1983 20.1%
1984 18.8%
1985 18.0%
1986 17.5%
1987 17.0%
1988 16.8%
1989 16.4%
1990 16.1%
1991 16.1%
1992 15.8%
1993 15.8%
1994 15.5%
1995 14.9%
1996 14.5%
1997 14.1%
1998 13.9%
1999 13.9%
2000 13.5%
2001 13.5%
2002 13.3%
2003 12.9%
2004 12.5%
2005 12.5%
2006 12.0%
2007 12.1%
2008 12.4%
2009 12.3%
2010 11.9%
2011 11.8%
2012 11.2%
2013 11.2%
Union membership peaked in the mid-1950s, when about 35% of workers were unionized.
How we stack up — Here’s a look at union membership around the world (percentage of employed who are union members):
Finland 69%
Denmark 69%
Sweden 68%
Norway 55%
Belgium 50%
Italy 36%
Ireland 31%
Austria 28%
Canada 27%
United Kingdom 26%
Greece 25%
Slovenia 24%
New Zealand 21%
Portugal 19%
Netherlands 18%
Germany 18%
Japan 18%
Australia 18%
Czech Republic 17%
Switzerland 17%
Slovak Republic 17%
Spain 16%
Chile 15%
Poland 15%
Mexico 14%
United States 11%
South Korea 10%
Estonia 8%
Turkey 5%
Why Have Things Changed?
What’s behind the decline in union membership in the U.S.?
Higher cost of salary and benefits for employers. Research suggests the cost of running a union operation is as much as 35% higher than a non-union operation.
Ideological opposition by employers to unions
Increasing public disapproval of unions
Approval/disapproval by year
Year Approval Disapproval
1936 72 20
1946 64 21
1956 75 14
1966 66 23
1976 59 31
1986 59 30
2001 65 28
2011 52 42
In Praise Of Unions
Here’s a look at some of the achievements of unions:
- Weekends
- All workday breaks, including lunch breaks
- Paid vacation
- Family Medical Leave Act
- Sick leave
- Minimum wage
- 8-hour workday
- Overtime pay
- Child labor laws
- 40-hour workweek
- Pension
- Collective-bargaining rights
- Holiday pay
- Sexual harassment laws
- Anti-sweatshop laws
Sources:
http://la.aflcio.org
http://blogs.berkeley.edu
http://www.nytimes.com
http://anh.com
http://www.gallup.com
http://www.unionstats.com
http://www.bls.gov